Diagrams
Diagrams are created using React Flow.
Create a src/vision/layouts/diagrams.json file (case-sensitive)
The src/vision/layouts/diagrams.json file is responsible for:
- Defining what OML Vision Diagrams can render
- Name of the Diagrams
- Name of the nodes for the Diagram
- Name of the edges for the Diagram
- Queries for the Diagram node content
- Queries for the Diagram edge content
- How to map Diagrams node queries to edge queries
It is formatted as a JSON data structure.
An example of what this looks like is seen below with the source code found here
{
  "decompositions": {
    "name": "Decomposition",
    "queries": {
      "decompositions": "component.sparql",
      "edge": "component.sparql"
    },
    "rowMapping": {
      "id": "decompositions",
      "name": "System",
      "labelFormat": "{c1_localname}",
      "colorKey": "c1_localname",
      "edgeMatchKey": "c1_localname"
    },
    "edges": [
      {
        "id": "edge",
        "name": "Edge",
        "labelFormat": "hasSubsystem",
        "colorKey": "c2_localname",
        "sourceKey": "c1_localname",
        "targetKey": "c2_localname"
      }
    ]
  },
  "movingscenario": {
    "name": "Scenario",
    "queries": {
      "movingscenario": "scenario_move.sparql",
      "edge": "scenario_move.sparql"
    },
    "rowMapping": {
      "id": "movingscenario",
      "name": "Task",
      "labelFormat": "{f2_id} \n {f2_cname}",
      "colorKey": "f2_id",
      "edgeMatchKey": "f2_id"
    },
    "edges": [
      {
        "id": "edge",
        "name": "Edge",
        "labelFormat": "invokes",
        "colorKey": "f2_id",
        "sourceKey": "f2_id",
        "targetKey": "f3_id"
      }
    ]
  }
}
Defining Diagram
A Diagram must be properly defined in order to be rendered by OML Vision
Terminology
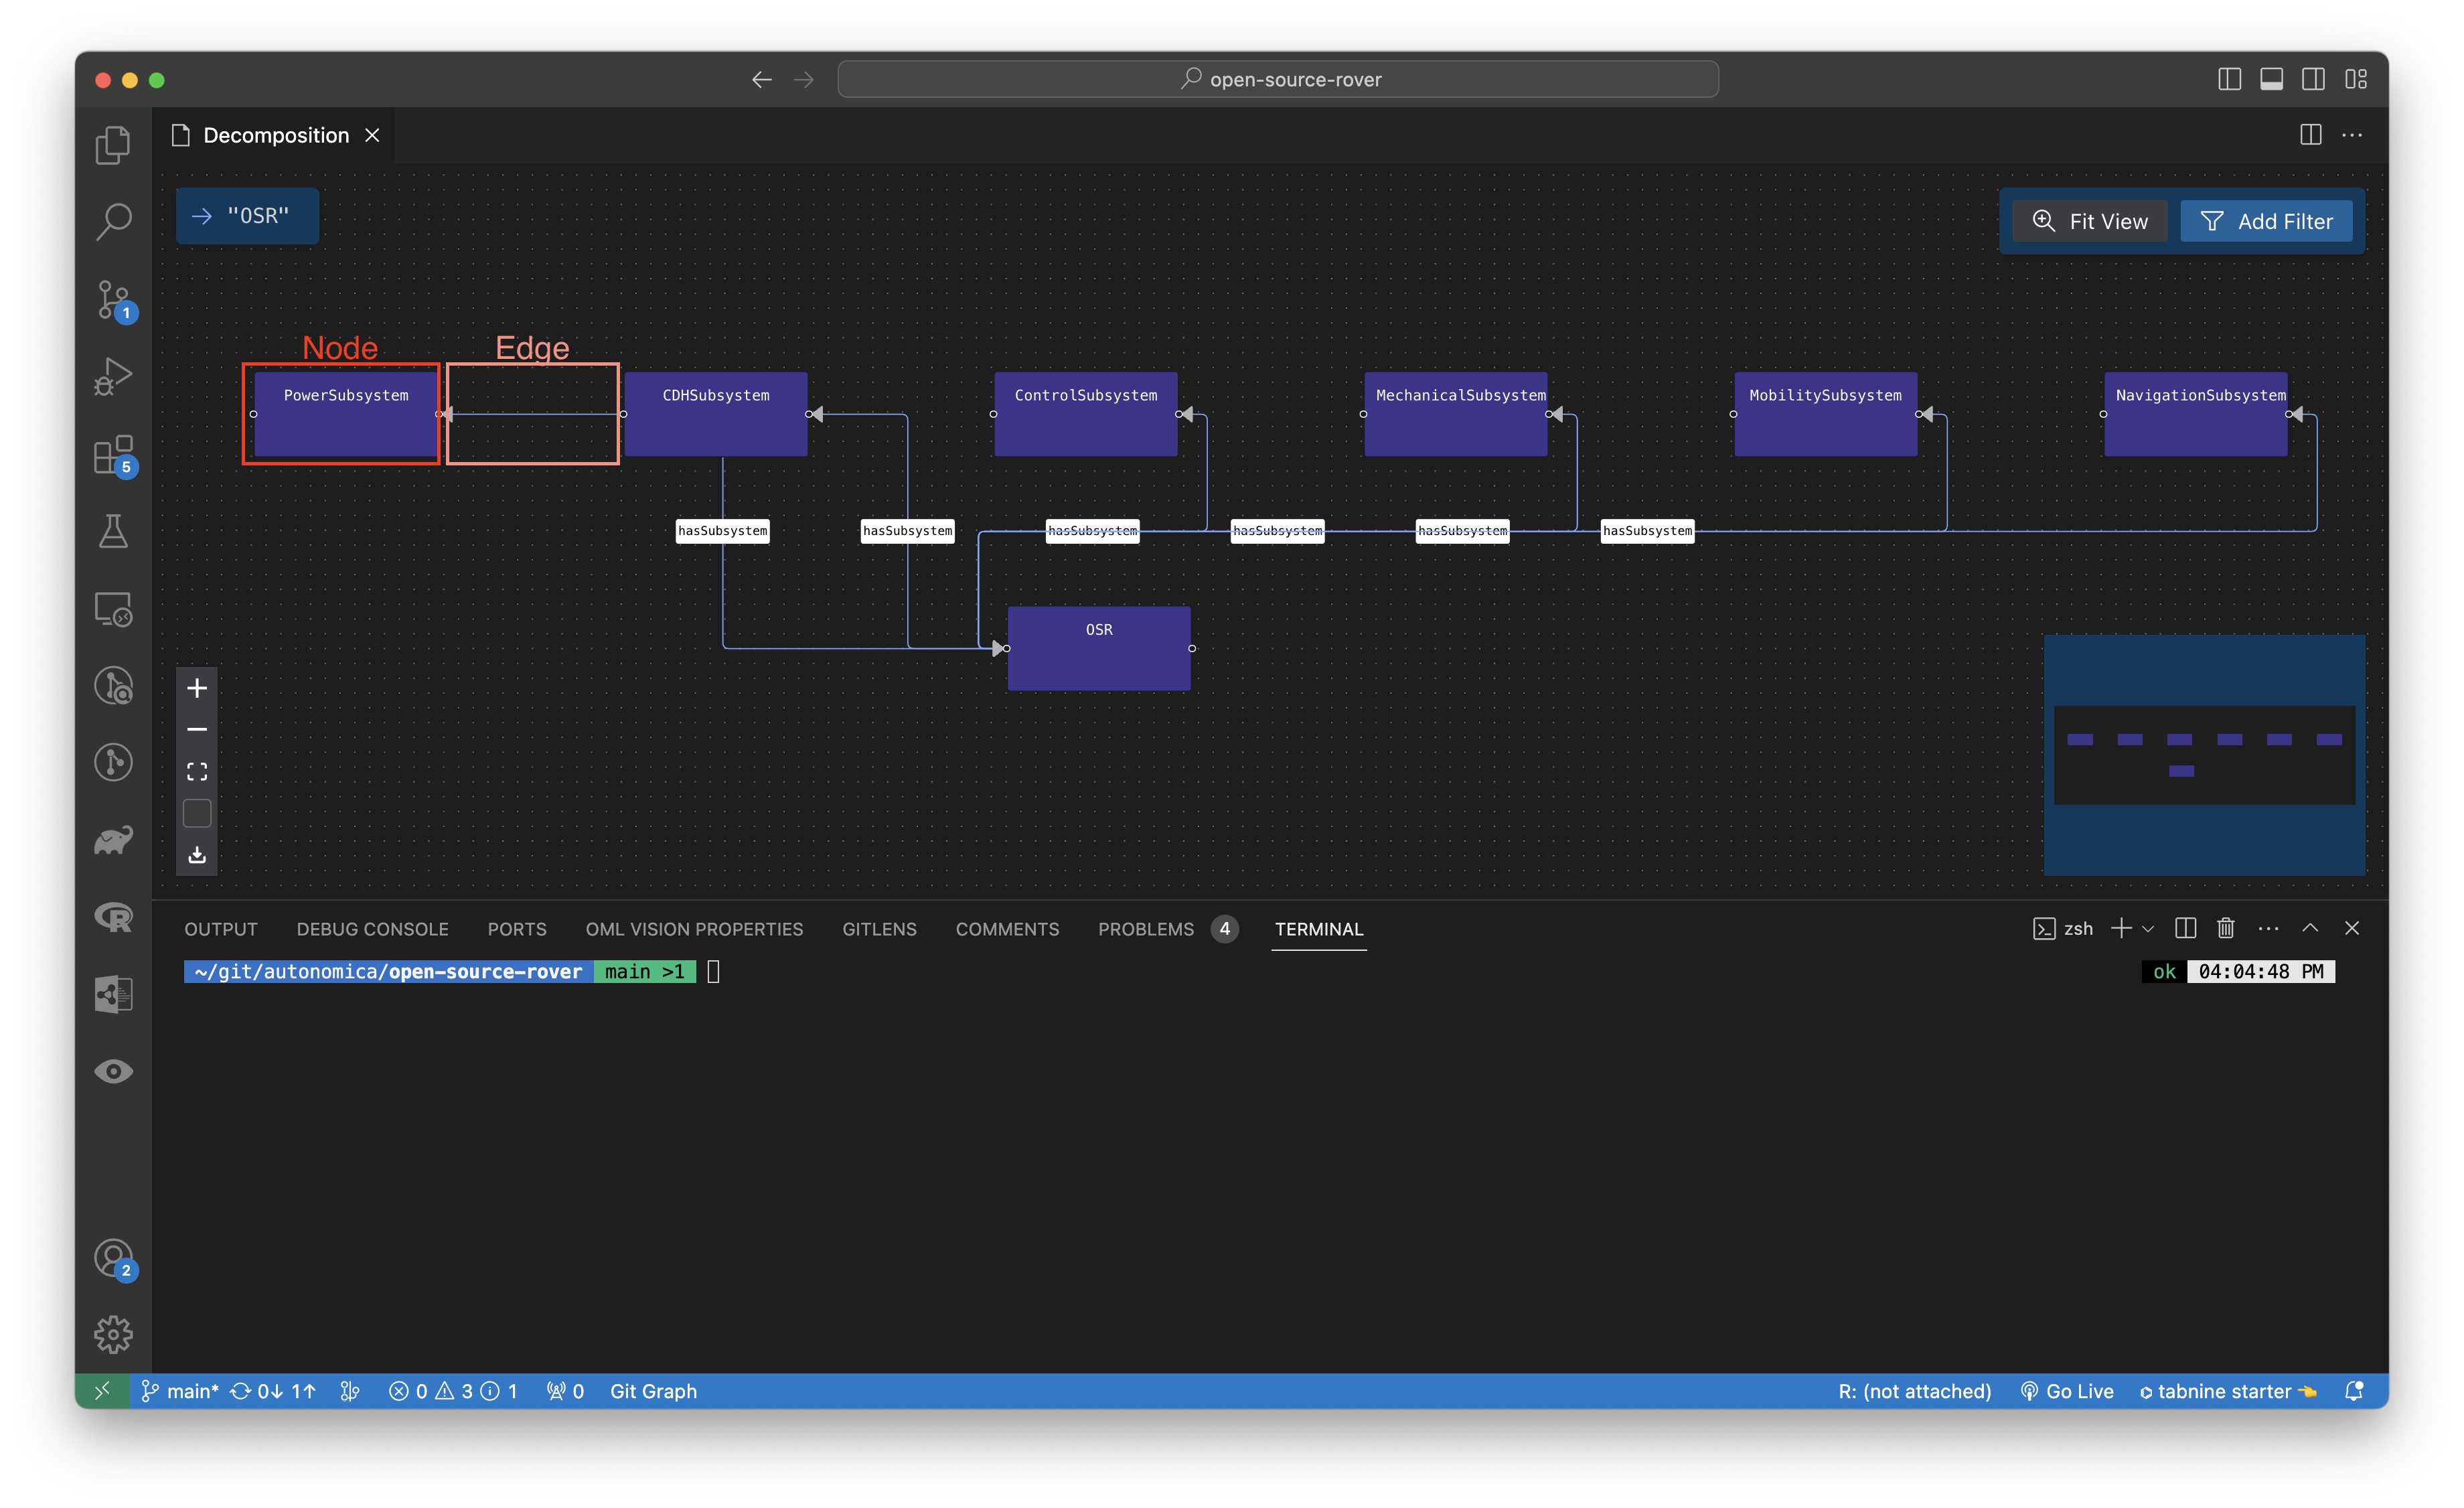
OML Vision defines a node and edge as follows:
- Node: A graphical element that contains information
- Edge: A graphical element that connects information

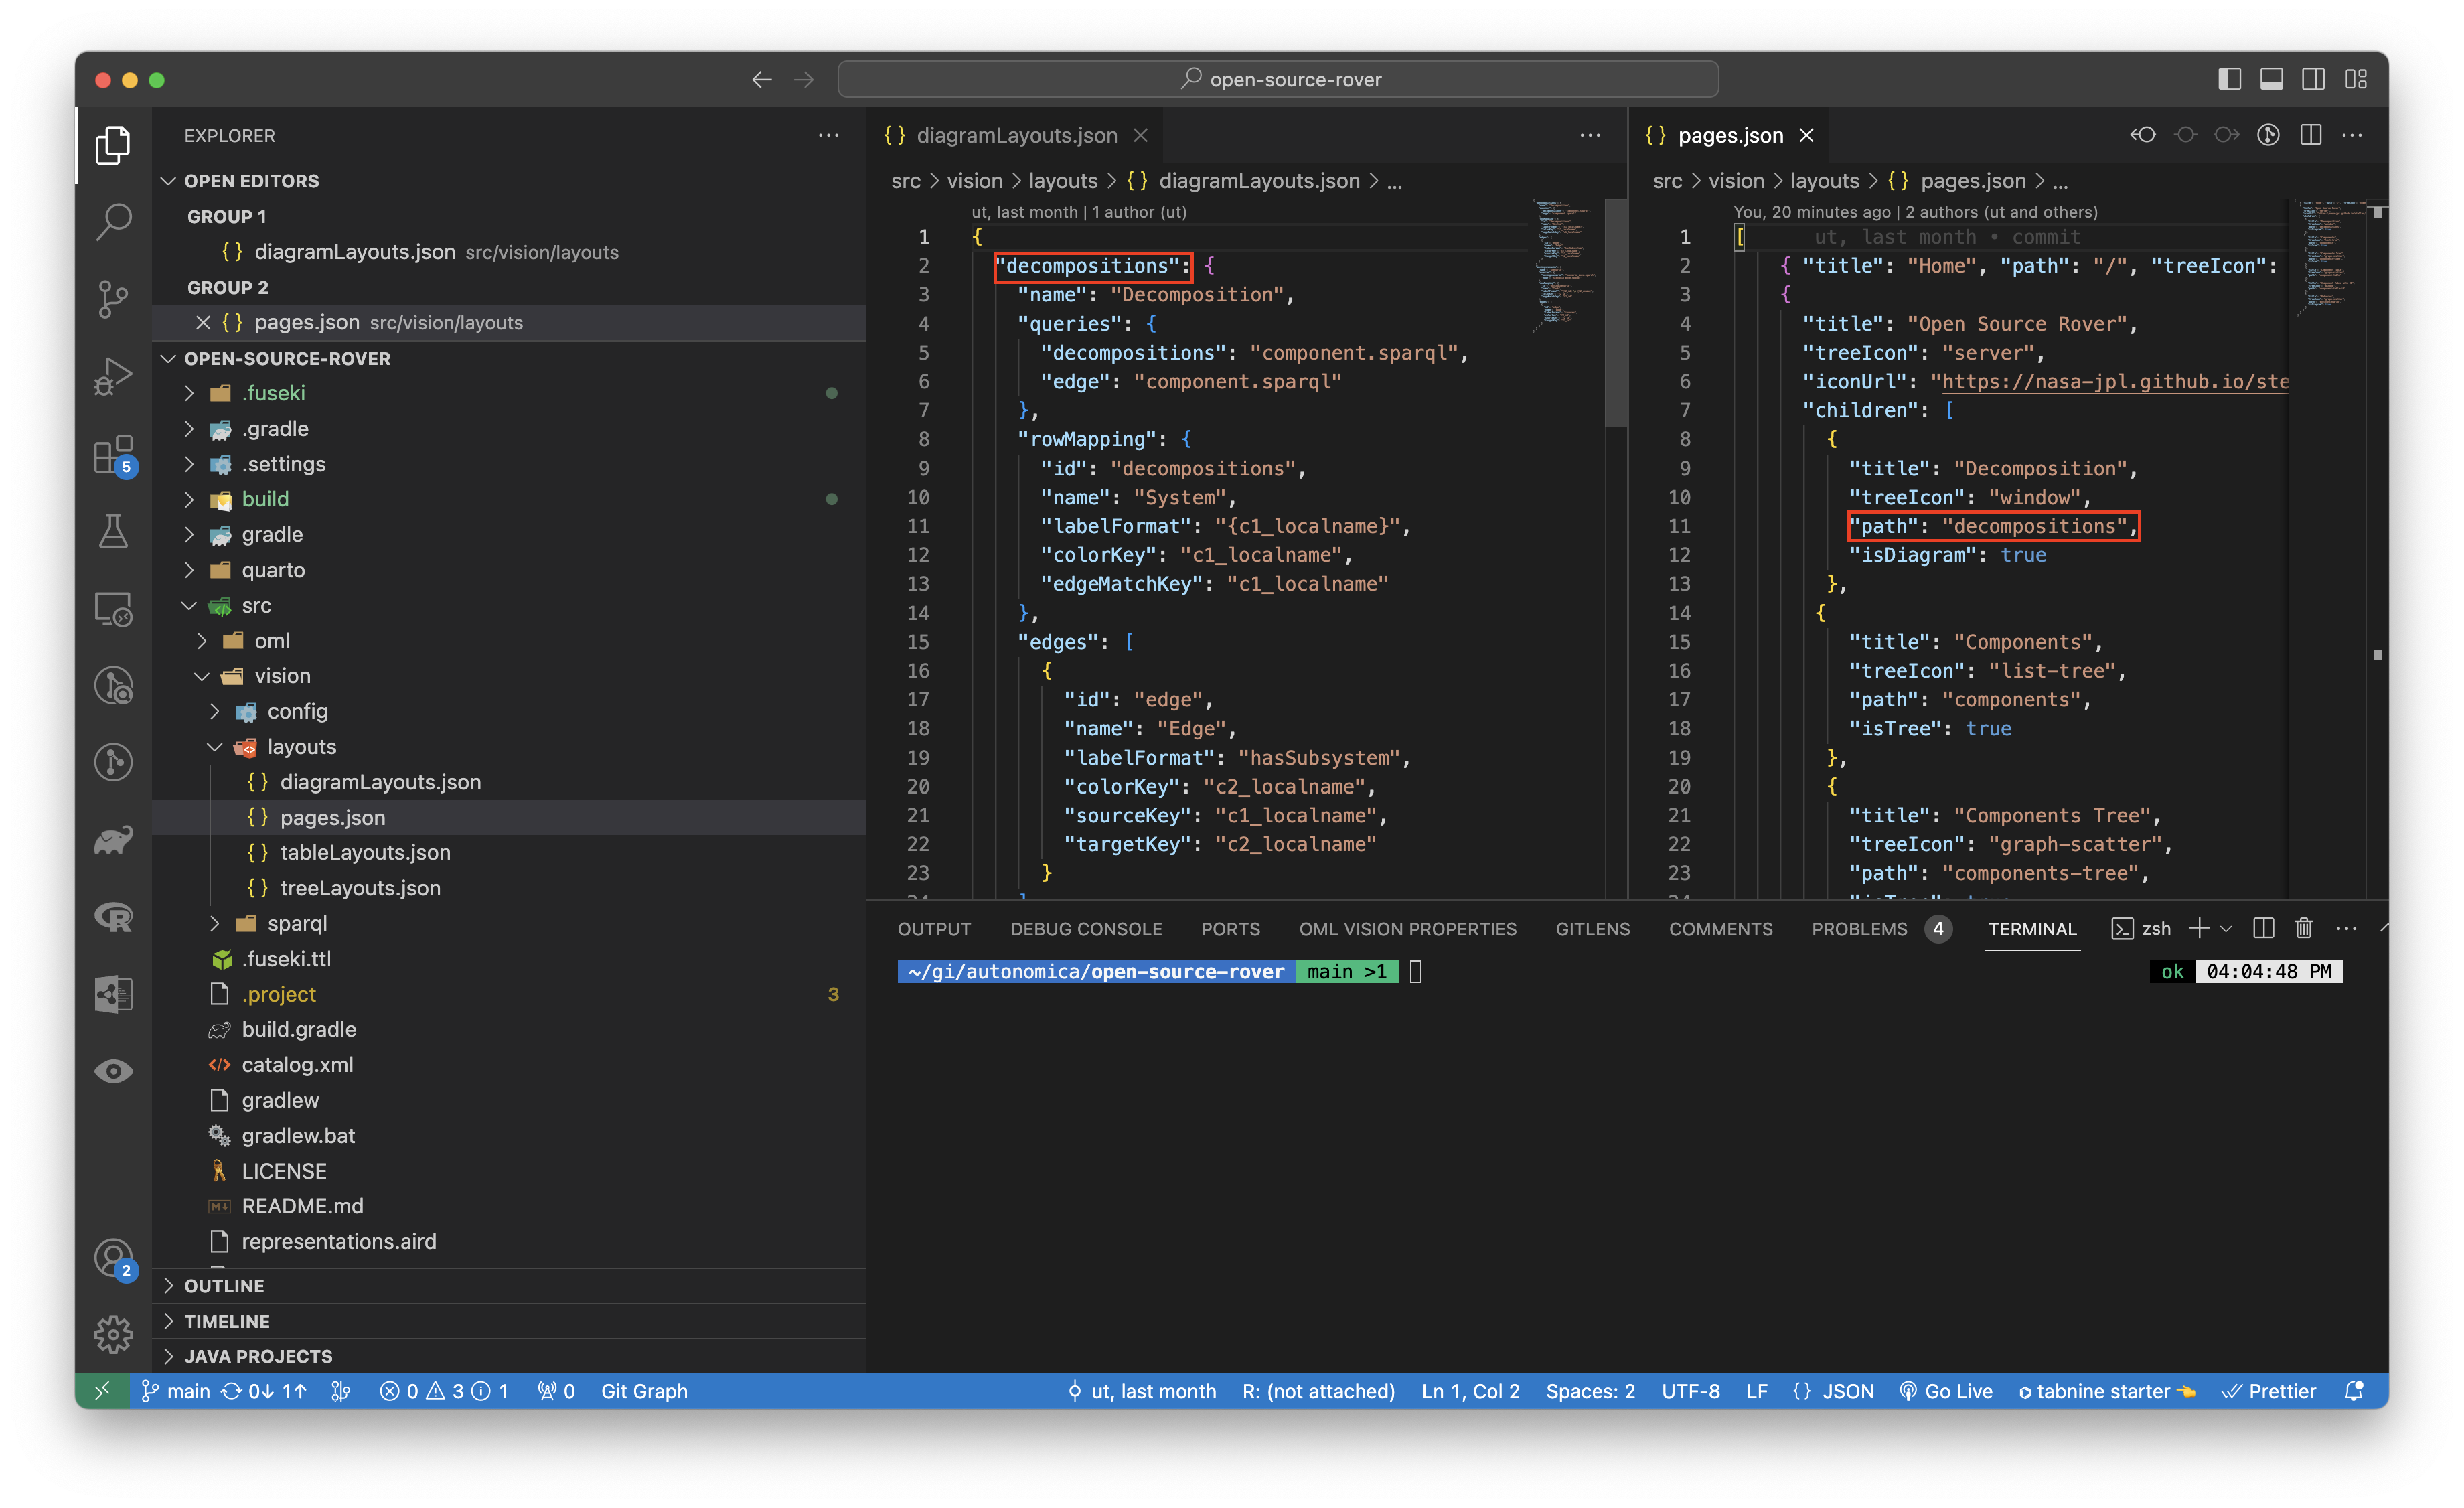
path
path: string
This string defines the path of the Diagram.
The name of the path is the same path that was defined in the pages.json.

name
name: string
This string gives a name to the Diagram in the diagramLayouts.json file.
queries
queries: {}
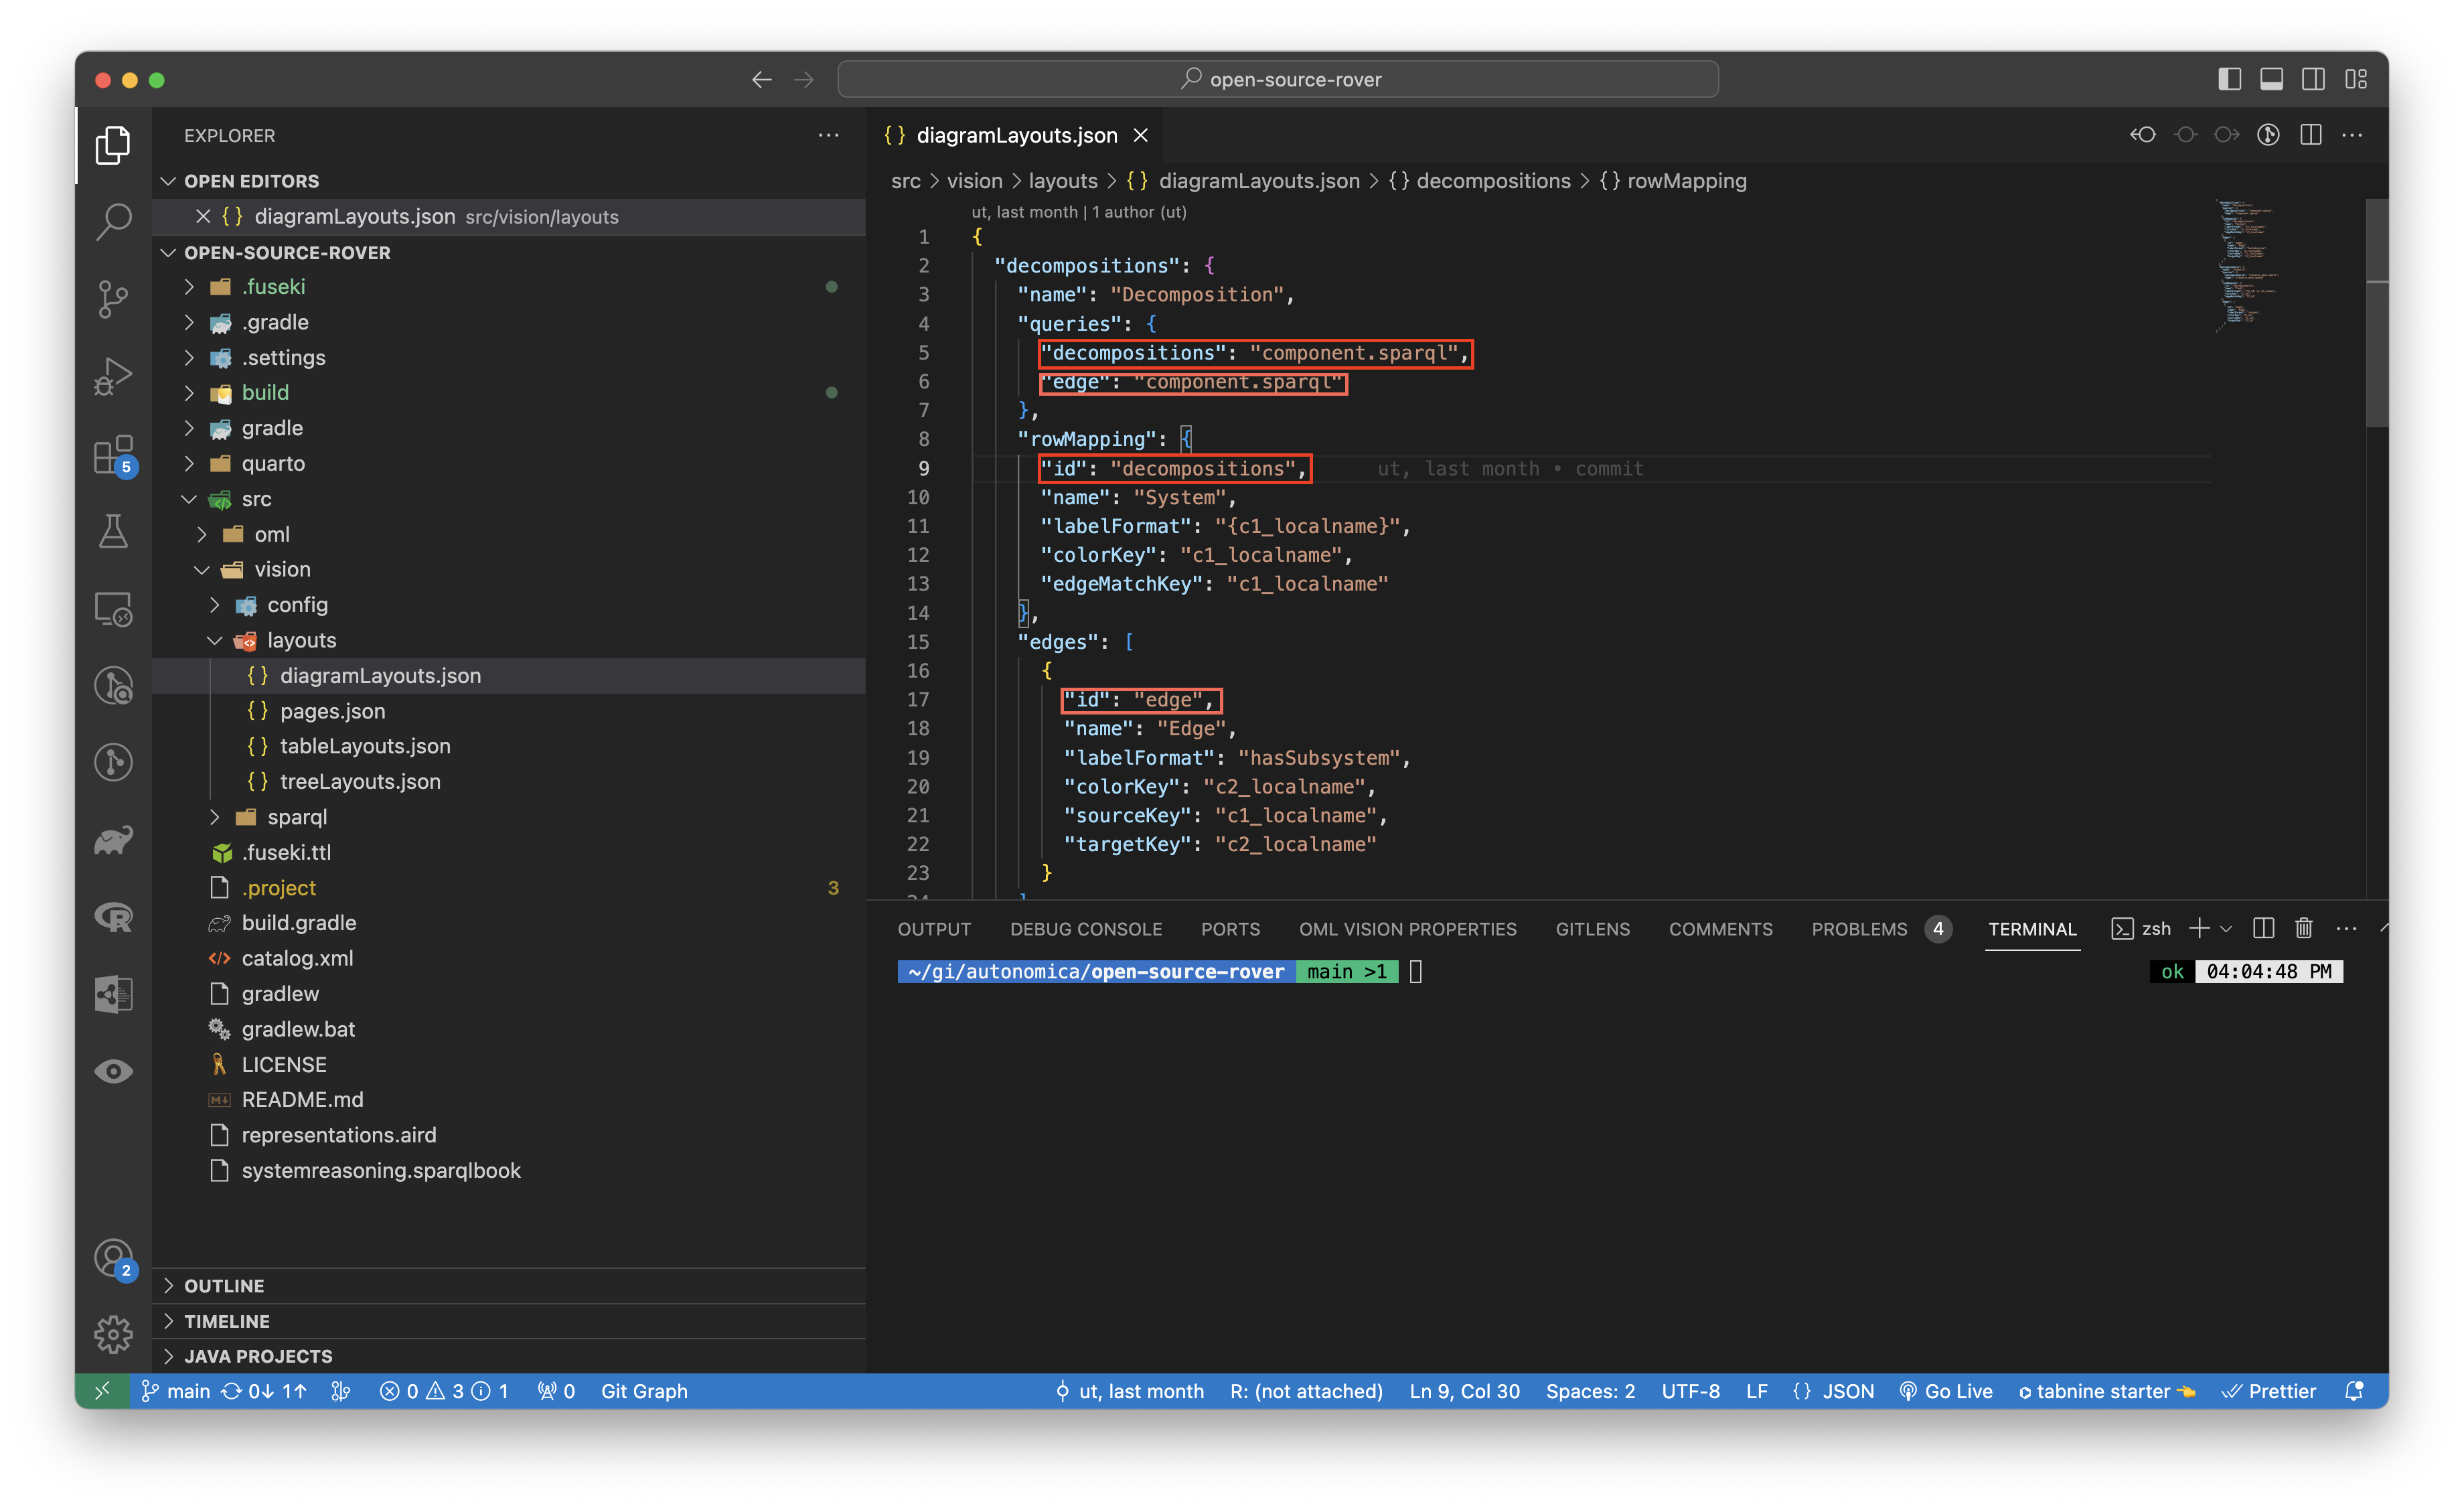
This object contains the queries that will query the RDF Triplestore for the content that will populate in the Diagram.
Look at the sparql docs for more info found here
You can test queries by going to localhost:3030 which is created once data is loaded into the Fuseki DB. You can watch more info about testing queries with Fuseki by going here
The AI & DS Channel (2021, February 18). SPARQL Query [Video]. YouTube. https://www.youtube.com/watch?v=w_pJ3XiBWeM&t=621s
rowMapping
rowMapping: {}
This object defines how the queries map to the columnNames
id
id: string
This string the id for the rowMapping.
The id correspond to one of the columnNames.

name
name: string
This string gives a name to the rowMapping.
labelFormat
labelFormat: string
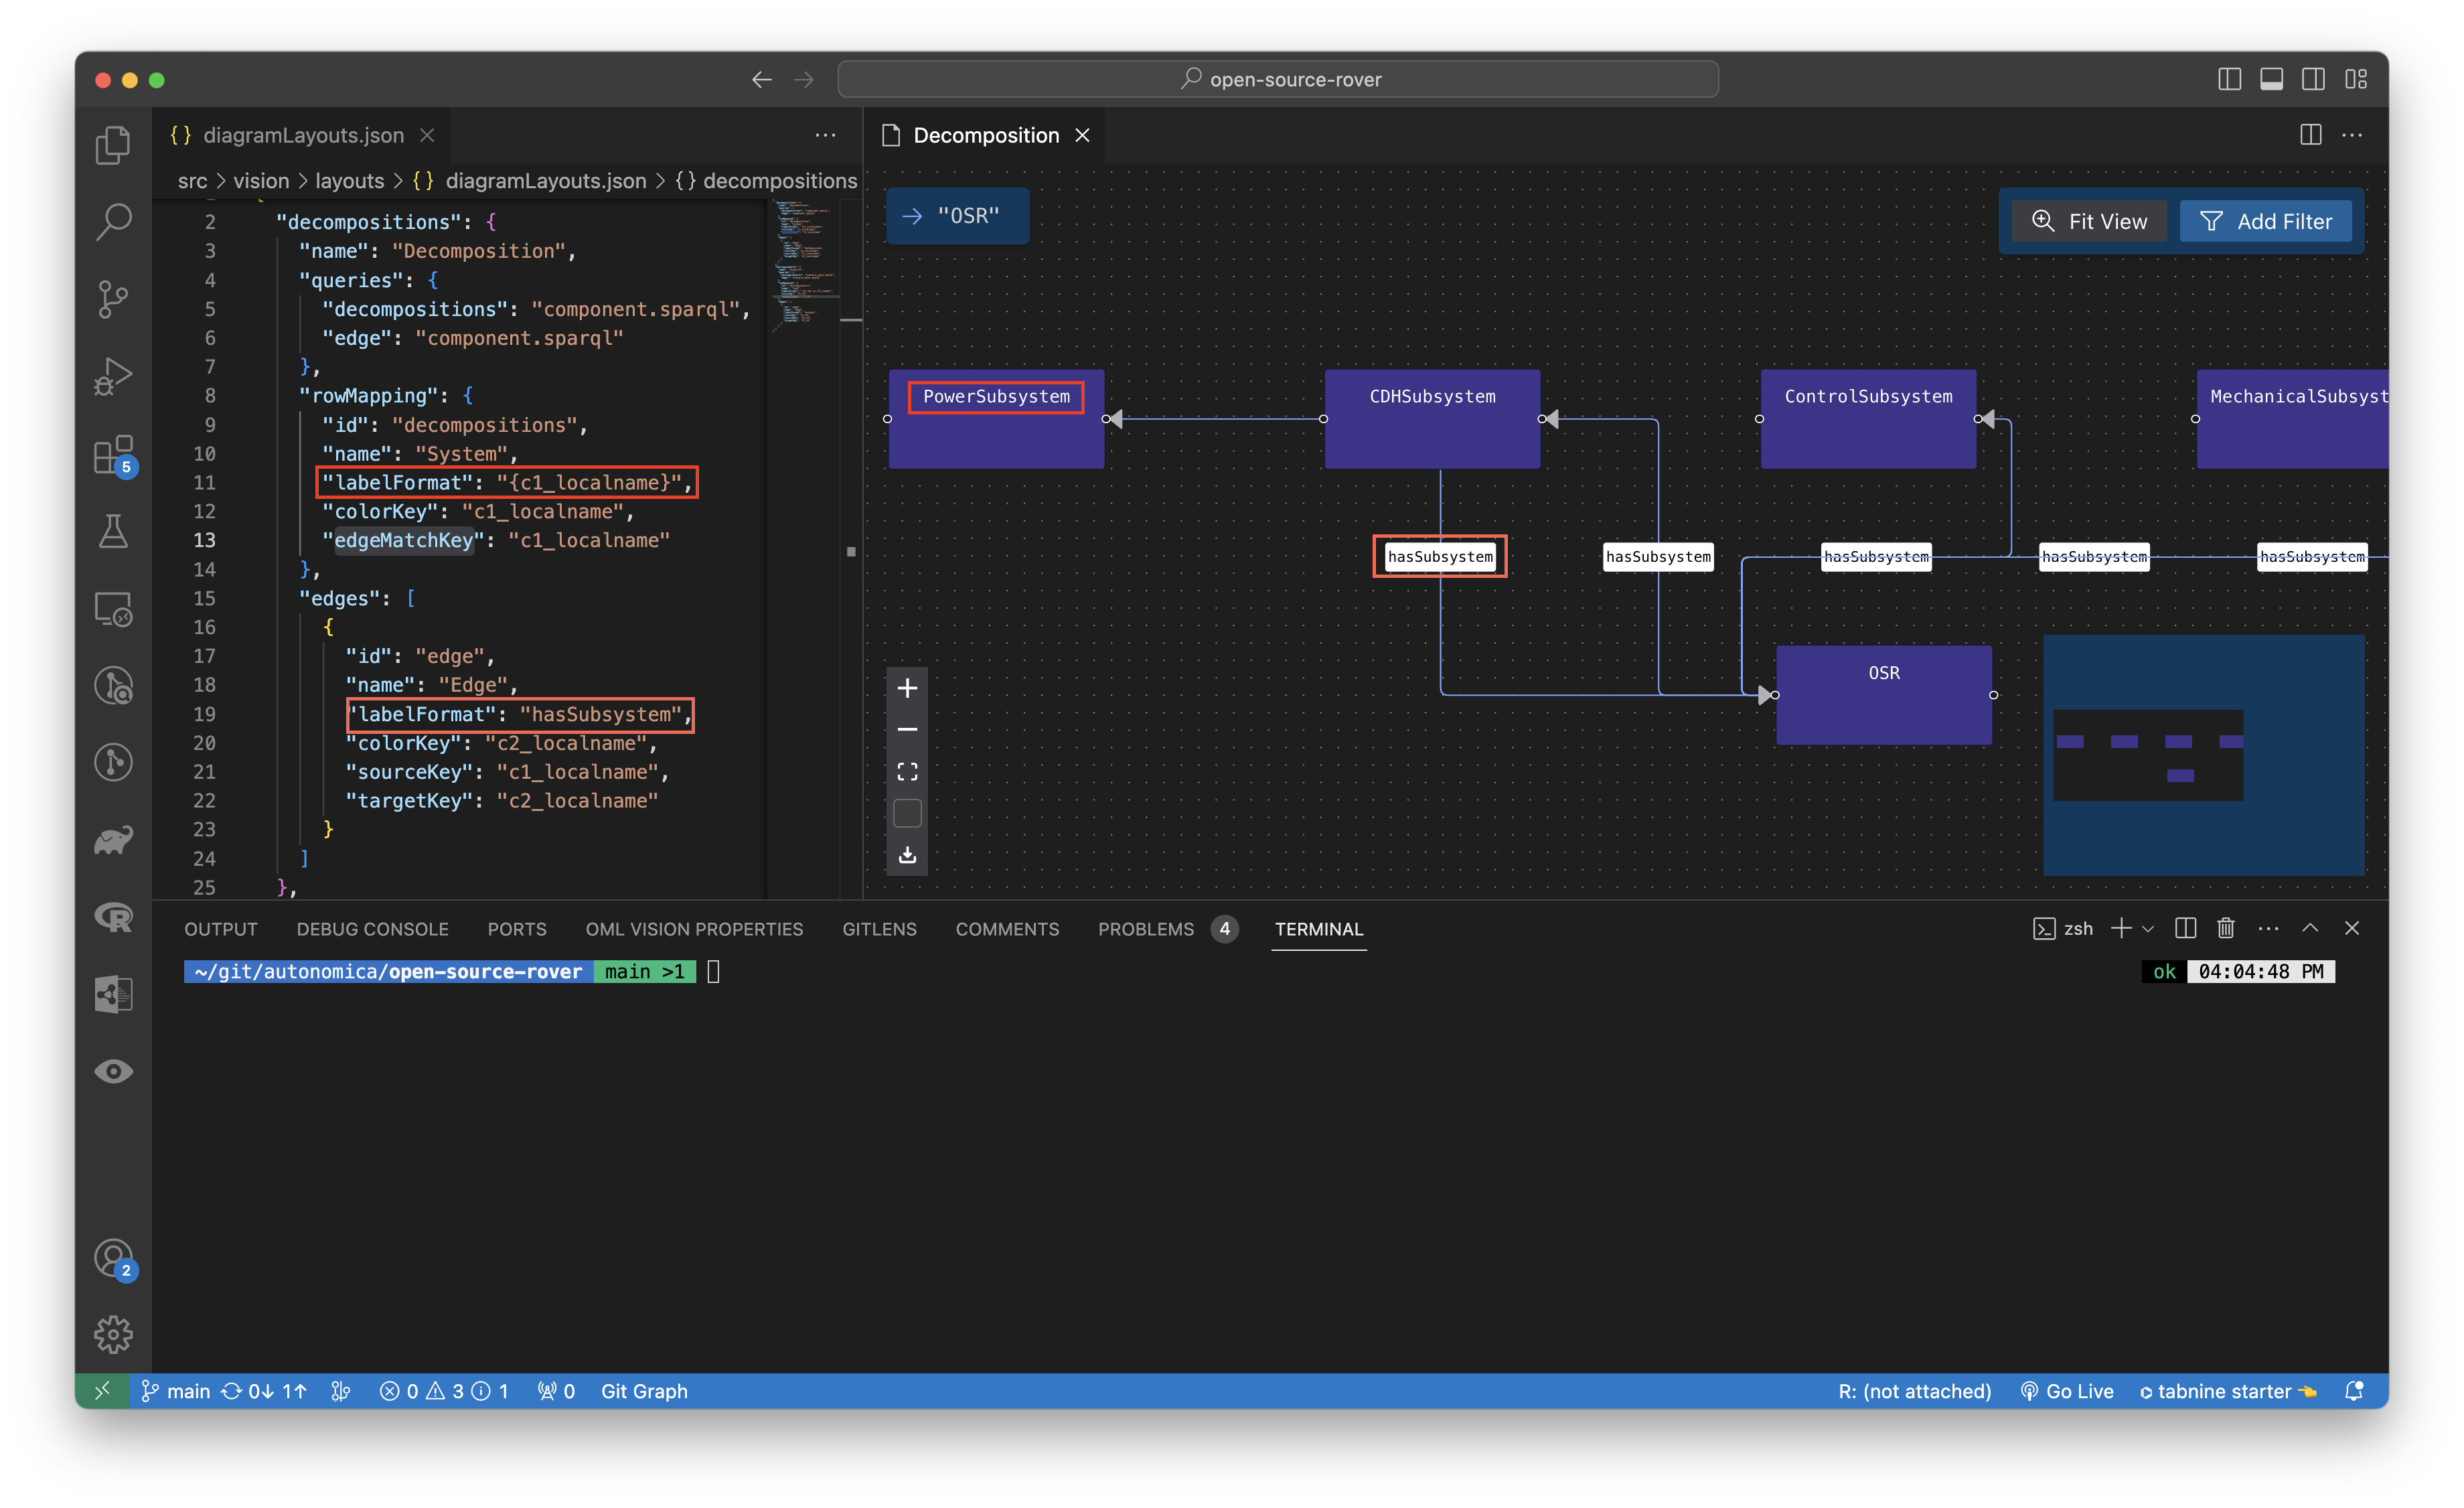
This string contains the label of the row for the rowMapping.
The labelFormat is rendered in the rows of the Diagram shown in the red boxes.
STRING INTERPOLATION
OML Vision supports string interpolation with the queries that were formatted. The format is "{string}"
An example is found here

colorKey
colorKey: string
This string is the seed for a random color generator for the nodes rendered in the Diagram. Needed to generate legend.
STRING INTERPOLATION
OML Vision supports string interpolation with the queries that were formatted. The format is "{string}"
edgeMatchKey
edgeMatchKey: string
This string defines the edge for each node in the Diagram.
STRING INTERPOLATION
OML Vision supports string interpolation with the queries that were formatted. The format is "{string}"
subRowMappings
subRowMappings: {
    id: string
    name: string
    labelFormat: string
    colorKey: string
    edgeMatchKey: string
  }[]
This subRowMappings array of objects defines the id, name, labelFormat, colorKey, and edgeMatchKey for the subrows of the Diagram.
The id, name, labelFormat, colorKey, and edgeMatchKey have the same data structure as rowMapping
edges
edges: {
    id: string
    name: string
    labelFormat: string
    colorKey: string
    sourceKey: string
    targetKey: string
  }[]
This edges array of objects defines the id, name, labelFormat, and colorKey for the edges of the Diagram.
The id, name, labelFormat, and colorKey have the same data structure as rowMapping
sourceKey
sourceKey: string
This string defines the source node for the edge in the Diagram.
targetKey
targetKey: string
This string defines the target node for the edge in the Diagram.